
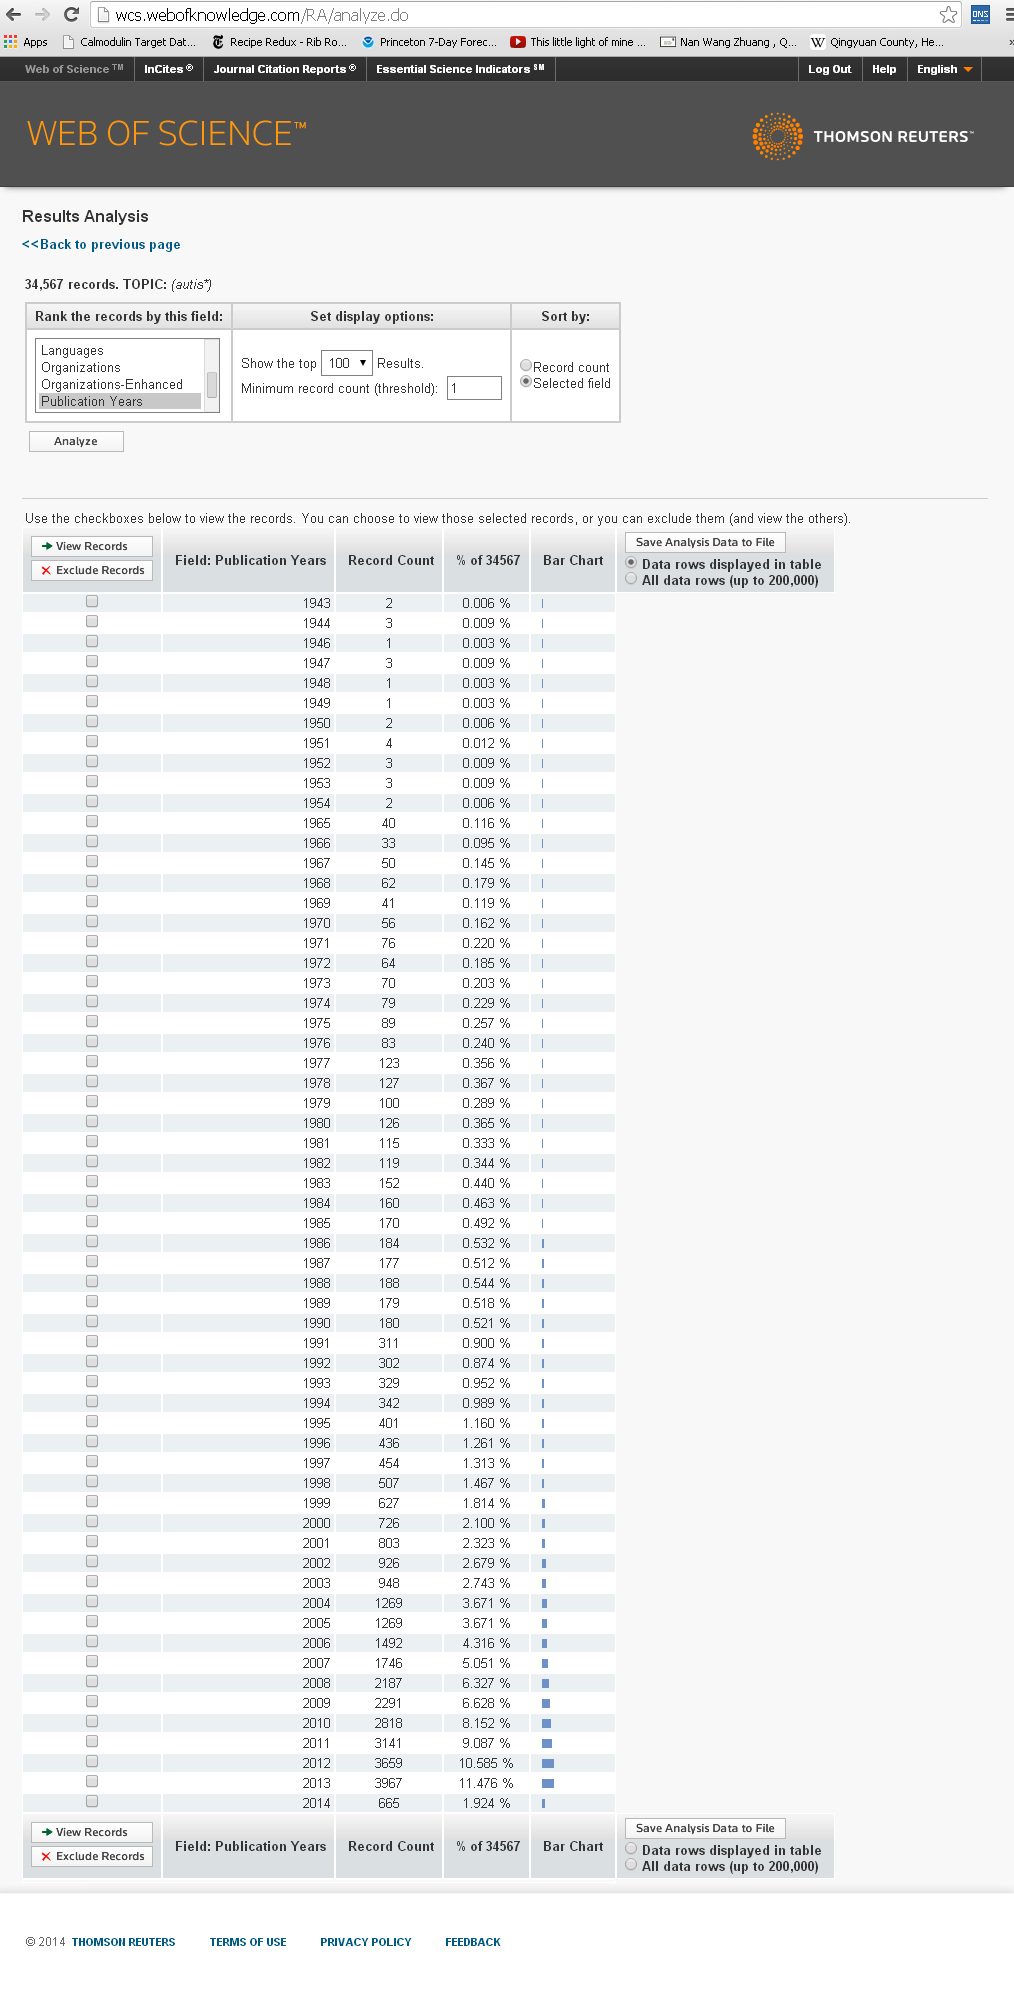
Over the last few years, we’ve seen an explosion of studies linking autism to a wide variety of genetic and environmental factors. Putting these studies in perspective is an enormous challenge. In a database search of more than 34,000scientific publications mentioning autism since its first description in 1943, over half have come since 2008.
As a statistically minded neuroscientist, I suggest a different approach that relies on a concept we are familiar with: relative odds. As a single common measuring stick to compare odds, I have chosen the “risk ratio,” a measure that allows the bigger picture to come into focus.
For a variety of studies I asked the same question: How large is the increased risk for autism? My standard for comparison was the likelihood in the general population of autism spectrum disorder. Here’s an example. Start from the fact that the recorded rate of autism is now 1 in 68, according to a report released last week by the Centers for Disease Control and Prevention. If babies born in purple farmhouses have a rate of autism of 2 in 68, this doubling means that the purple farmhouse carries a risk ratio of 2. However, correlation is not causation, and there is no need to repaint that farmhouse just yet.